


Most pet hotels don't have a data problem. They have a dashboard problem.
Somewhere in the last few years, almost every facility picked up a booking system with a reporting tab, maybe a payment processor with its own charts, and a spreadsheet someone keeps "updated." Now occupancy lives on one screen, revenue on another, and a gut feeling fills the gaps. When a big pricing or staffing call comes up, everyone stares at the dashboards for a minute — then makes the decision the way they always have. Memory and instinct.
That's the trap. Dashboards show you things. They don't help you decide things. There's a real gap between "occupancy was 71% last month" and "we should raise Saturday large-dog rates by $6 and see what happens." Closing that gap is what analytics maturity actually means — and it's the difference between a facility that reacts and one that runs experiments and compounds small wins over time.
This is a roadmap for getting there. Not a tool list, not a KPI dump — a staged path from raw dashboards to decision-grade analytics, with data ownership sorted out, experiment templates you can copy, and a 90-day plan that won't blow up your team's week.
The four stages of pet hotel analytics maturity
Before you can move forward, you need to be honest about where you actually are. Almost every facility falls into one of four stages, and the mistake people make is thinking they're one stage ahead of reality.
| Stage | What it looks like | What decisions get made | Common failure |
|---|---|---|---|
| 1. Manual | Numbers live in exports, someone's head, or handwritten logs | Reactive, gut-based | Nobody agrees on what "occupancy" even means |
| 2. Descriptive | Dashboards exist, updated weekly-ish | "Here's what happened" reporting | Data is looked at, rarely acted on |
| 3. Diagnostic | Numbers are trusted, people ask why | Root-cause conversations happen | Insights don't turn into structured tests |
| 4. Decision-grade | Metrics tied to experiments and owners | Changes get tested, measured, kept or killed | Requires discipline most teams underestimate |
The uncomfortable truth: most pet hotels think they're at Stage 3 but are really sitting at Stage 2. The tell is simple — when something looks off in the dashboard, does anyone do something structured about it, or does it get mentioned in the Monday meeting and forgotten? If it's the latter, you're at descriptive, no matter how nice your charts look.
Stage 4 isn't about fancier tools. It's about a habit: every meaningful number has a person who owns it and an experiment attached to it when it drifts. That's the whole game.
Why facilities get stuck at "descriptive"
The stall almost always comes from the same three places, and none of them are technical.
Never miss a booking or detail again.
GoPetel simplifies pet hotel operations by managing every reservation and pet profile seamlessly.
- Centralized booking management
- Automated client notifications
- Staff and kennel scheduling
No credit card required
First, nobody owns the numbers. When occupancy is technically "everyone's responsibility," it's actually nobody's. The front desk assumes the manager watches it. The manager assumes the owner does. The number sits there, looked at by three people and acted on by zero.
Second, the definitions are mushy. Ask three staff members what "utilization" means and you'll get three different answers. One counts booked kennels, one counts occupied nights, one counts revenue-weighted capacity. When the definition floats, trust evaporates — and untrusted numbers never drive decisions.
Third, there's no path from insight to action. Even when someone notices "our weekday large-dog occupancy is soft," there's no template for turning that observation into a test. So it becomes an opinion, gets debated, and dies. Facilities that actually break through don't usually have better data — they have a pipeline for it. Clean inputs, clear owners, and a repeatable way to run experiments. If your numbers still come out of manual exports every week, that pipeline problem is worth fixing first; there's a full breakdown in the low-code data-integration playbook for automating KPI pipelines.
Building a prioritized metric map
You can't make everything decision-grade at once. Teams that try end up with 40 metrics — all half-trusted, none acted on. The move is to prioritize brutally.
A metric earns a spot on your decision-grade map only if it clears three tests:
-
It moves money. A shift in this number changes revenue or cost in a way you can feel.
-
It's controllable. Your team can actually influence it through decisions, not just watch it happen.
-
It's measurable cleanly. You can define it in one sentence and pull it the same way every time.
Run your current dashboard against those filters and most metrics fall off. That's fine. You want a short list — five to seven numbers — that carry the actual weight of the business. If you haven't figured out which numbers those are yet, the six KPIs every pet hotel needs and the experiments that fix them is a good place to start before you build the full map.
Here's a rough priority tiering that works for most single-site facilities:
Tier 1 — decide weekly: occupancy/utilization by kennel type, average revenue per occupied night, rebook rate.
Tier 2 — decide monthly: channel mix and cost, no-show/cancellation rate, add-on attach rate.
Tier 3 — watch, don't chase: review scores, average length of stay, seasonal lead times.
Start with metrics that directly affect weekly cash flow so test results show financial impact quickly.
One thing people miss: a metric's tier isn't fixed. During peak season, lead-time forecasting jumps to Tier 1. In a soft month, add-on attach might matter more than raw occupancy. The map should breathe with the calendar, not sit frozen on a wall.
RACI: who actually owns the data
This is the part everyone skips, and it's the part that makes or breaks everything else. Without clear ownership, your metric map just becomes another dashboard nobody acts on.
RACI is four roles per metric: Responsible (does the work), Accountable (owns the outcome — one person only), Consulted (has input), Informed (gets told). For pet hotels you can keep it lean.
| Metric | Responsible | Accountable | Consulted | Informed |
|---|---|---|---|---|
| Occupancy by kennel type | Front desk lead | GM | Owner | Whole team |
| Rebook rate | Client-success staff | GM | Front desk | Owner |
| Add-on attach rate | Shift leads | Ops manager | Groomer | GM |
| No-show / cancellation | Front desk lead | Ops manager | — | GM |
| Channel cost | Owner/bookkeeper | Owner | GM | — |
The single most important rule: Accountable is always one named human. The second you write "the team" or two names in that column, accountability dissolves. If occupancy slides for three weeks straight, exactly one person should feel that and be expected to explain what they're testing about it.
Worth noting — the Responsible person is usually closer to the floor than owners expect. The front desk lead sees occupancy shifts before any dashboard does. Push responsibility down, keep accountability clear, and information actually moves.
Turning observations into experiments
Decision-grade analytics lives or dies on this step. A number that drifts is not an insight — it becomes useful only when it triggers a structured test. Without a template, "let's try something" turns into chaos you can't measure.
Keep the experiment template dead simple. Every test should fit on one page:
-
Observation — what did the number tell you? ("Weekday large-dog occupancy is running around 55%, weekends near 90%.")
-
Hypothesis — what do you think will move it? ("A weekday large-dog discount will lift midweek nights without cannibalizing weekend demand.")
-
The change — one variable, clearly stated. ("$10 off large-dog boarding, Mon–Wed only, next 4 weeks.")
-
Metric watched — the one number that decides success, plus one guardrail. (Watch weekday large-dog occupancy; guardrail: total revenue per available night.)
-
Duration + sample — how long, how many bookings before you judge.
-
Decision rule — written before you start. ("If weekday occupancy climbs above 70% and revenue per available night holds, keep it. Otherwise kill it.")
Here's a visual workflow you can follow.
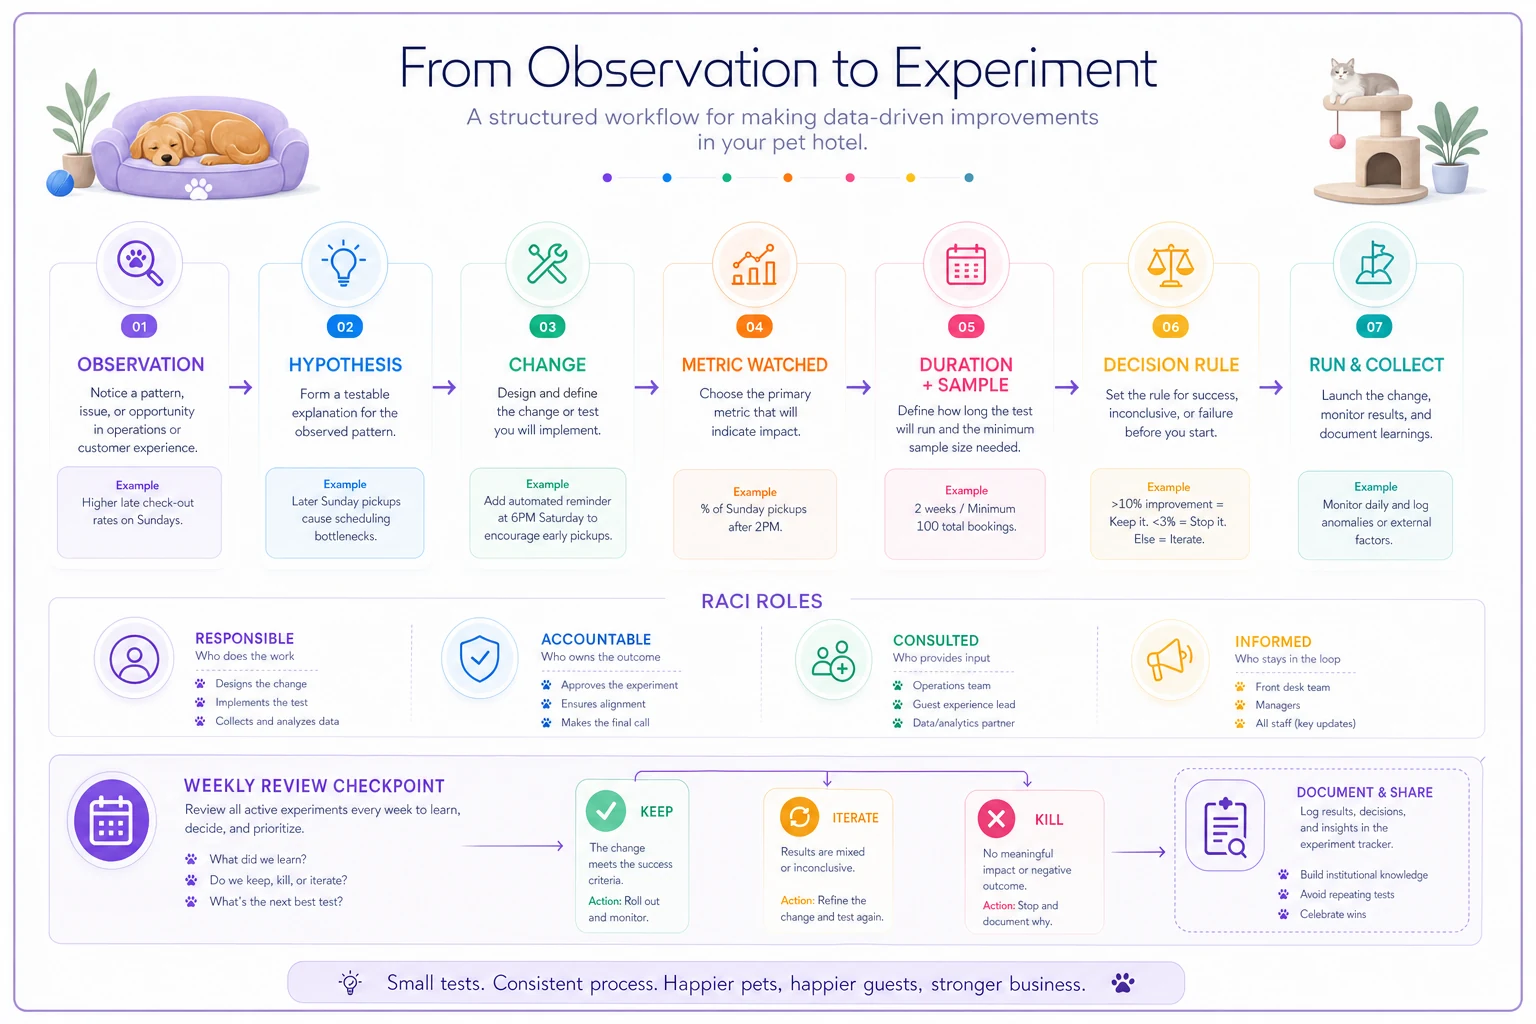
The decision rule written in advance is the whole point. Teams that decide success criteria after seeing results always find a way to call it a win — that's how bad ideas survive for years. Write the kill condition first, and mean it.
Run one experiment at a time per metric area. Two overlapping pricing tests and you'll never know which one moved the needle.
A short real scenario
A single-site facility with around 40 kennels was sitting at Stage 2 — decent dashboards, weekly glances, no real action. Weekday occupancy hovered around 58% while weekends stayed slammed. Everyone knew this. Nobody owned it.
They did three things over a quarter. Assigned the front desk lead as Responsible for weekday occupancy, with the GM as Accountable. Ran one experiment: a modest midweek discount on their two softest kennel types, with a written kill condition on revenue per available night. Held a 20-minute weekly review focused only on the experiment — nothing else.
By the end, weekday occupancy landed somewhere in the high 60s. Not a miracle, but roughly a dozen extra occupied nights a week that were previously empty. The bigger shift was cultural: the team had run their first real experiment and actually trusted the result because the rules were set upfront. That's what Stage 3-to-4 feels like in practice. Undramatic, repeatable, and it compounds.
The 90-day plan
You don't need a year. Three focused months, each with one job.
Days 1–30: Foundation and honesty
-
Audit where you actually are on the maturity stages — be honest about it.
-
Pick your 5–7 Tier 1 and Tier 2 metrics. No more.
-
Write one-sentence definitions for each. Get the team to agree on them.
-
Fix the ugliest data source so at least those metrics are trustworthy.
Days 31–60: Ownership and first test
-
Fill out the RACI table. One Accountable name per metric.
-
Set up a single weekly 20-minute metric review.
-
Launch your first experiment using the template. Just one.
-
Resist adding new metrics. Depth beats breadth here.
Days 61–90: Rhythm and expansion
-
Judge the first experiment against its written decision rule — keep, kill, or iterate.
-
Launch a second experiment in a different metric area.
-
Document what worked so the next test starts faster.
-
Review the metric map — did any tiers shift with the season?
The reason this works is you're building a habit, not a report. By day 90, the team should expect that drifting numbers get owned and tested — not debated and dropped.
When this makes sense — and when it doesn't
Worth doing if: you're consistently at 60%+ occupancy, making regular pricing or staffing decisions, and you have at least one person with 20 spare minutes a week to own the review. Facilities in growth mode or approaching multi-site especially need this — gut feel doesn't survive a second location.
Bad idea if your data is still so messy that no number is really trustworthy. Fixing definitions and inputs comes first. Running experiments on garbage data just gives you confident wrong answers, which is worse than no answers at all.
Who should not rush this: a brand-new facility with three months of history. You don't have enough baseline to run meaningful experiments yet. Spend the first year at Stage 2 building clean, consistent data — then graduate to decision-grade. Running pricing experiments on thin data is how people fool themselves into thinking they've learned something.
The real shift
Analytics maturity isn't about the software you buy or how many charts you can generate. It's about closing the distance between seeing a number and acting on it — with clear ownership, clean definitions, and experiments that have their kill conditions written before anyone looks at results.
Most facilities will stay at the dashboard stage indefinitely, glancing at occupancy and running on instinct. The ones that move to decision-grade don't do anything flashy. They just make sure every number that matters has a name attached to it and a test ready when it drifts. Do that for a quarter, and you stop guessing. You start compounding.
Ready to optimize your pet hotel operations?
Join hundreds of pet hotels using GoPetel to save time, improve pet care, and increase booking reliability.