
Running a pet hotel without tracking the right metrics is like driving at night with your headlights off. You might get by on instinct for a while, but eventually you'll hit something expensive.
The problem isn't that pet hotel owners don't track numbers. Most operators I've worked with actually track too many things—daily revenue, individual staff hours, every customer complaint, grooming add-ons, weekend vs. weekday occupancy splits. They've got spreadsheets everywhere. What they don't have is a system that tells them what to fix tomorrow morning.
A good pet hotel KPI dashboard isn't about data collection. It's about operational decisions. Every metric should map to specific experiments you can run to improve that number within 30 days.
The fatal flaw in most pet hotel dashboards
Most pet hotel dashboards fail because they track vanity metrics instead of operational drivers. Revenue looks great until you realize labor costs are eating 65% of it. Occupancy seems solid at 80% until you notice half your premium suites sit empty while standard kennels overflow.
The deeper issue: these dashboards don't connect metrics to fixable problems. Knowing your no-show rate is 12% doesn't help unless you have a playbook for reducing it. Seeing labor costs spike doesn't matter if you can't tell whether it's overtime abuse, inefficient scheduling, or just a busy season.
I've built dashboards for facilities ranging from 20-kennel boutique operations to 150+ run mega-facilities. The ones that actually move the needle share three things: they track leading indicators not just results, they update frequently enough to catch problems early, and every metric connects to a specific experiment you can test.
The 6-metric framework that actually works
After digging through operational data from dozens of facilities, six metrics consistently predict profitability and operational health better than anything else. More importantly, each one responds to specific changes you can test within weeks.
Never miss a booking or detail again.
GoPetel simplifies pet hotel operations by managing every reservation and pet profile seamlessly.
- Centralized booking management
- Automated client notifications
- Staff and kennel scheduling
No credit card required
| Metric | Formula |
|---|---|
| Effective Occupancy Rate (not just occupancy) | (Revenue Generated / Maximum Possible Revenue) × 100 |
| Labor Efficiency Score | Revenue per labor hour worked (including all staff) |
| Service Attach Rate | (Customers purchasing add-ons / Total customers) × 100 |
| Check-in Cycle Time | Average minutes from arrival to kennel placement |
| Rebooking Rate | (Customers who book again within 90 days / Total customers) × 100 |
| Revenue per Available Kennel Night (RevPAK) | Total revenue / Total available kennel nights |
1. Effective Occupancy Rate (not just occupancy)
Formula: (Revenue Generated / Maximum Possible Revenue) × 100
-
Booking system (occupied nights by kennel type)
-
POS system (actual revenue per night)
-
Pricing sheet (rack rates by kennel type)
Update cadence: Daily calculation, weekly review
Sample visualization: Heat map showing occupancy by kennel type and day of week. Red zones show where you're leaving money on the table.
-
Effective occupancy below 65% despite 80%+ physical occupancy
-
Luxury suites under 50% occupancy while standard kennels overflow
-
Weekend effective occupancy dropping below weekday rates
2. Labor Efficiency Score
Formula: Revenue per labor hour worked (including all staff)
-
Timeclock system (actual hours worked)
-
Daily revenue reports
-
Schedule vs. actual comparison
Update cadence: Daily tracking, weekly analysis
Sample visualization: Line graph comparing revenue per labor hour across different shift patterns. Overlay with occupancy to spot where the gaps are.
-
Labor efficiency below $45/hour during peak season
-
Score dropping more than 15% on weekends
-
Morning shift efficiency running 30%+ lower than afternoon
3. Service Attach Rate
Formula: (Customers purchasing add-ons / Total customers) × 100
-
POS transaction details
-
Booking system service flags
-
Daily service completion logs
Update cadence: Weekly calculation, monthly trend analysis
Sample visualization: Stacked bar chart showing attach rates by service type and booking channel. Phone bookings typically run about 2x higher attach rates than online—something worth paying attention to.
-
Overall attach rate below 25%
-
Dramatic variance between staff members (some at 40%, others at 10%)
-
Grooming attach rate under 15% despite available grooming capacity
4. Check-in Cycle Time
Formula: Average minutes from arrival to kennel placement
Most facilities never measure this, but slow check-ins create cascading problems throughout your entire operation. Long cycle times mean a backed-up lobby, stressed pets, and staff pulled away from other tasks at exactly the wrong time.
-
Arrival log timestamps
-
Kennel assignment times
-
Security camera footage (for validation)
Update cadence: Daily measurement, weekly averaging
Sample visualization: Box plot showing cycle time distribution by day and hour. Outliers almost always reveal a specific bottleneck pattern.
-
Average cycle time over 12 minutes
-
Peak hour cycle times exceeding 20 minutes
-
Standard deviation above 5 minutes (signals an inconsistent process)
5. Rebooking Rate
Formula: (Customers who book again within 90 days / Total customers) × 100
-
Customer booking history
-
90-day lookback reports
-
Customer segmentation data
Update cadence: Monthly calculation with 90-day rolling window
Sample visualization: Cohort retention curve showing rebooking rates by customer acquisition month. Some months produce sticky customers—worth understanding why.
-
Overall rebooking below 35%
-
New customer rebooking under 25%
-
Declining trend for three or more consecutive months
6. Revenue per Available Kennel Night (RevPAK)
Formula: Total revenue / Total available kennel nights
-
Daily revenue reports
-
Facility capacity logs
-
Maintenance/blocked kennel records
Update cadence: Daily calculation, weekly trending
Sample visualization: Area chart showing RevPAK trends with annotations for pricing changes, promotions, and seasonal events.
-
RevPAK below $35 for standard kennels
-
Declining RevPAK despite stable occupancy
-
Weekend RevPAK lower than weekday
More importantly, each one responds to specific changes you can test within weeks.
Building your dashboard: tools and setup
You don't need expensive business intelligence software. Most sub-50 kennel facilities can build this entire dashboard in Google Sheets with basic data imports.
-
CSV exports from your booking system (daily)
-
Google Sheets or Excel with basic formulas
-
2–3 hours for initial configuration
-
15 minutes daily for data entry and validation
For facilities running modern booking software, many of these metrics can be calculated automatically. The challenge isn't getting the data—it's knowing which numbers actually matter and what to do when they move.
Dashboard layout principle: Every metric gets three views:
-
Current period actual vs. target
-
Trend line (last 12 weeks)
-
Quick experiment checklist (what to try if the number is off)
If your booking system can schedule daily CSV exports, automate that first—manual imports are where these dashboards die.
This diagram shows the basic data flow from booking system to dashboard and experiment checklist.
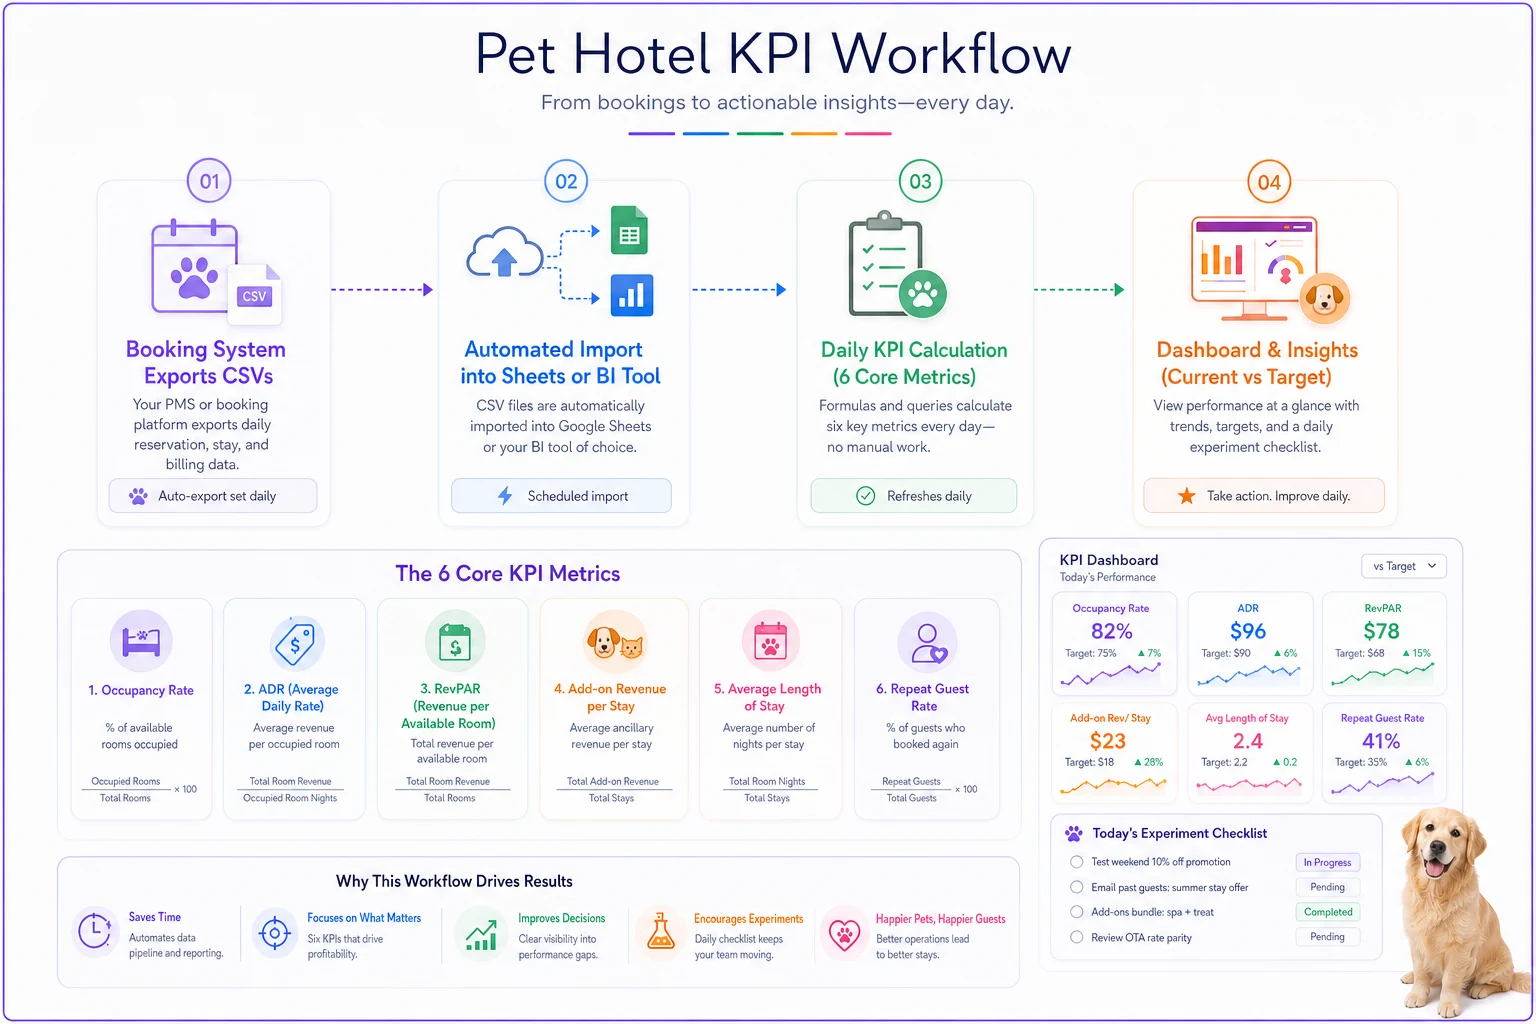
Every metric gets three views: current vs. target, trend line, and a quick experiment checklist to act on when numbers drift.
The 30-day experiment playbook
Dashboards without action plans are expensive wallpaper. Here's exactly what to test when each metric drops.
When Effective Occupancy drops below 65%:
Days 1–7: Audit your pricing structure
-
Compare your rates against three of your closest competitors
-
Check if suite prices are more than 2.5x standard kennel rates (that gap creates a psychological barrier)
-
Identify which kennel types consistently underperform
Days 8–21: Test targeted promotions
-
Offer suite upgrades at 50% off to returning customers
-
Create midweek suite packages with grooming bundled in
-
Test dynamic pricing
drop suite prices 20% when occupancy falls below 40%
Days 22–30: Restructure your inventory
-
Convert underperforming luxury suites to premium doubles
-
Adjust your kennel zoning to match actual demand patterns
-
Test different minimum night requirements by kennel type
Success metric: Effective occupancy increases 10+ percentage points
When Labor Efficiency drops below $45/hour:
Days 1–5: Time study your workflows
-
Track actual task times vs. scheduled times
-
Identify where staff cluster (usually around check-in and check-out)
-
Document the "invisible" tasks eating into productive time
Days 6–15: Implement staggered scheduling
-
Shift 30% of staff start times by 30 minutes
-
Create dedicated roles—check-in specialist vs. kennel attendant
-
Test 4-hour shifts for peak periods only
Days 16–25: Reduce repetitive task drag
-
Batch feeding times by kennel zone
-
Implement parallel cleaning protocols
-
Create prefilled check-in packets for regular customers
Days 26–30: Measure and adjust
-
Calculate the new efficiency score
-
Survey staff on what actually helped
-
Lock in changes that show 20%+ improvement
Success metric: Achieve $52+ revenue per labor hour
When Service Attach Rate falls below 25%:
Days 1–3: Mystery shop your own booking process
-
Call and make a reservation as a new customer
-
Note how many times services get mentioned—or don't
-
Check whether online booking surfaces add-ons prominently
Days 4–14: Implement systematic offering
-
Add a required "services discussion" checkpoint in the booking flow
-
Train staff to mention the top three services on every booking
-
Put a visual service menu at the check-in desk
Days 15–25: Test bundling
-
Create a "Pampered Pup Package" with boarding, bath, and playtime
-
Offer 20% off services booked at reservation rather than day-of
-
Test mandatory nail trims for stays over five nights
Days 26–30: Analyze by channel
-
Compare attach rates
phone vs. online vs. walk-in
-
Identify which services sell well together
-
Build scripts for your lowest-performing channel
Success metric: Reach 35%+ attach rate
When Check-in Cycle Time exceeds 12 minutes:
Days 1–2: Map the current check-in flow
-
Time each step from parking to kennel placement
-
Identify exactly where customers are waiting
-
Count how many times the same information gets re-entered
Days 3–10: Cut redundant steps
-
Send paperwork via pre-arrival email
-
Move payment processing to the end, not the beginning
-
Assign kennels at booking rather than at arrival
Days 11–20: Test express check-in options
-
Create a separate line for prepared customers
-
Implement a text-on-arrival system
-
Pilot curbside drop-off for regulars
Days 21–30: Standardize what worked
-
Create a visual check-in map for staff
-
Post expected times for each step
-
Recognize staff who consistently hit sub-10 minute averages
Success metric: Average cycle time under 8 minutes
The 90-day expansion playbook
Once your 30-day experiments show results, expand what's working across the operation.
Month 1: Stabilize and document
Make the improvements stick. Document exactly what changed, train all staff on the new procedures, and keep measuring daily. Most facilities backslide here—old habits creep back the moment you stop actively managing the change.
Month 2: Connect the metrics
Start looking at how KPIs interact. High service attach rates sometimes correlate with longer check-in times. Fixing one metric can quietly break another. Use this month to find the right balance and understand where the trade-offs actually live.
Key relationships to monitor:
-
Labor efficiency vs. check-in time (more staff speeds check-ins but hurts efficiency)
-
Effective occupancy vs. rebooking rate (aggressive pricing can erode retention)
-
Service attach vs. cycle time (selling takes time, and that time adds up)
Month 3: Automate the tracking
By now you know what worked. Build those changes into your standard operating procedures. More importantly, automate as much dashboard tracking as possible so it doesn't become another manual task that gets dropped when things get busy.
Modern pet hotel software can automatically calculate most of these metrics, send alerts when numbers drift, and flag patterns worth investigating. The goal isn't to remove human judgment—it's to make that judgment faster and better-informed.
When good metrics go bad
The efficiency trap: Pushing labor efficiency too hard leads to rushed service, stressed pets, and declining rebooking rates. If efficiency climbs but rebooking falls, you've cut too deep.
The occupancy obsession: Filling every kennel sounds great until you realize you're turning away higher-value customers for discount bookings. Effective occupancy below 60% with 90%+ physical occupancy means you're leaving serious money on the kennel floor.
The attach rate arms race: Pushing services too aggressively annoys customers. If attach rate climbs but rebooking drops, dial back the sales pressure.
The speed demon: Check-ins under 5 minutes sound impressive but probably mean important steps are getting skipped. Missing vaccination checks or behavior notes will cost you eventually.
Making dashboards drive decisions
The difference between facilities that improve and those that just track numbers comes down to how fast they respond. When a metric drops, how quickly do you act? When an experiment works, how fast do you scale it?
Most pet hotel operators check their numbers weekly, sometimes monthly. But problems compound daily. A 10% drop in service attach rate means you're losing roughly $150–300 every single day in a 40-kennel facility. Wait a month to notice and you've left $4,500 on the table.
This is where automated operational software shifts things. Instead of manually calculating metrics, modern platforms track KPIs in real-time, alert you when numbers drift, and can flag which experiments have worked for similar facilities. It's not a replacement for good operational judgment—it just means you're not flying blind.
Even with basic tools, the framework holds: track these six metrics, update them consistently, and always have your next experiment ready. The facilities that thrive aren't necessarily the ones with perfect operations—they're the ones that improve faster than everyone else.
Your next 30 days
Building a pet hotel KPI dashboard that drives real improvement isn't about complex analytics or expensive software. It's about choosing metrics that connect to fixable problems, tracking them consistently, and running experiments when numbers drift.
Start with one metric. Pick whichever is causing you the most pain right now. Set up basic tracking, run the 30-day experiment, and document what happens. Once you see improvement, add the next metric. Within six months you'll have shifted from reactive management to something that actually resembles proactive optimization.
The experiments outlined here aren't theoretical—they're based on what's worked across dozens of real facilities. Some will work for you, others won't. The point isn't to follow the playbook blindly but to build your own experimentation rhythm.
Every metric tells a story about your operation. The question is whether you're paying attention, and whether you're ready to act on what you find.
Ready to optimize your pet hotel operations?
Join hundreds of pet hotels using GoPetel to save time, improve pet care, and increase booking reliability.