



Most pet hotels don't have a forecasting problem. They have a timing problem. The calendar eventually fills, but the decisions that actually move money—how many kennel techs to schedule, when to raise rates, how much food and litter to order—all get made too late, based on where bookings are instead of where they're heading.
A calendar that's 40% booked three weeks out means very different things depending on the week. If that's a normal Tuesday-to-Thursday stretch, you're probably fine. If it's the week before Thanksgiving, you're already behind and should have raised prices ten days ago. The number on the screen is identical. The correct action is opposite. That gap—between raw occupancy and pace-adjusted occupancy—is where pet hotel occupancy forecasting either earns its keep or falls apart.
This piece is about building a lightweight system that reads booking pace, cancellations, and partner signals early enough to actually do something about them. Not a data science project. Something a manager can run in an hour a week and trust.
The core mistake: reading the calendar as a snapshot
Owners look at their booking software, see the occupancy percentage for an upcoming date, and treat it as a fact. But occupancy on any given future date is a moving object. What matters is the slope—how fast reservations are accumulating compared to how fast they normally accumulate for that type of date.
A typical example: two facilities, both showing 55% booked for the same holiday week, 18 days out. Facility A got there slowly and steadily. Facility B hit 55% in the last four days after a sudden rush. These are not the same situation. B is going to sell out and probably underpriced itself. A might stall at 70% and need a promo. Same snapshot, two entirely different pricing and staffing responses.
The reason this keeps happening is simple: booking software is built to show you state, not velocity. It answers "how full am I?" It doesn't answer "how full will I be, and how fast am I getting there?" So people fill that gap with gut feeling, and gut feeling fails hardest exactly when it matters most—holidays, long weekends, weather events—because those are the low-frequency periods you have the least real intuition about.
What actually feeds a forecast worth trusting
You don't need a hundred variables. At small and mid-size facilities, three signal families do almost all the useful work.
Never miss a booking or detail again.
GoPetel simplifies pet hotel operations by managing every reservation and pet profile seamlessly.
- Centralized booking management
- Automated client notifications
- Staff and kennel scheduling
No credit card required
Booking pace by lead time. For each date type (regular weekday, weekend, minor holiday, major holiday), you track how bookings normally accumulate as the date approaches. This is your baseline curve. At 30 days out you might normally be 20% booked for a holiday; at 14 days, 45%; at 7 days, 70%. When a specific date deviates from its own historical curve, that deviation is your earliest and most honest signal.
Cancellations and their timing. Gross bookings lie. A week that's "80% booked" with a 15% typical cancellation rate is really closer to 68% expected. And cancellation behavior isn't random—it clusters by lead time and by customer type. Bookings made far in advance cancel more often. Corporate accounts cancel differently than one-time vacation clients. If your forecast uses gross reservations instead of net expected occupancy, you'll consistently over-staff and over-order.
Partner and external signals. This is the part most facilities ignore. Referral vets, groomers you share clients with, local event calendars, school break schedules, even a big conference downtown—these move demand days before it shows up in your own bookings. A partner boarding facility going offline for renovations sends you overflow you can plan for if you're paying attention.
The goal isn't a single occupancy number. It's a net expected occupancy with a lead-time context, so the same 55% reads as "on pace," "running hot," or "running cold."
Turning a forecast into an action, not a chart
A forecast nobody acts on is just decoration. The system only pays off when each signal maps to a specific, boring decision. Three action lanes cover most of it.
| Signal reading | Staffing action | Procurement action | Pricing action |
|---|---|---|---|
| Running hot vs. baseline (pace ahead) | Add a shift / call in flex staff early | Bump food & consumables order this cycle | Raise rates on remaining inventory; tighten discounts |
| On pace | Hold planned roster | Standard reorder | Hold rates; keep standard promos |
| Running cold (pace behind) | Trim hours, consolidate shifts | Delay or reduce non-perishable orders | Release targeted promo; open waitlist tier |
| Cancellation spike, short lead | Keep flex staff on standby | No change | Reopen inventory; light last-minute promo |
| Partner overflow signal | Pre-schedule extra coverage | Pre-stock | Protect premium units; hold rate |
The value isn't the table itself—it's that everyone stops arguing about what "busy" means. When pace crosses a threshold, the response is already decided. The judgment moves upstream, into setting the thresholds once, instead of relitigating it every week.
If you've already worked through the pricing side, this connects directly to the utilization logic in Stop leaving money on the kennel floor: pricing, packaging & utilization systems for pet hotels. Forecasting is what tells you when to pull those pricing levers instead of guessing.
Building the baseline: a simple weekly process
You can stand this up with a spreadsheet before you touch anything fancier. Here's the sequence.
-
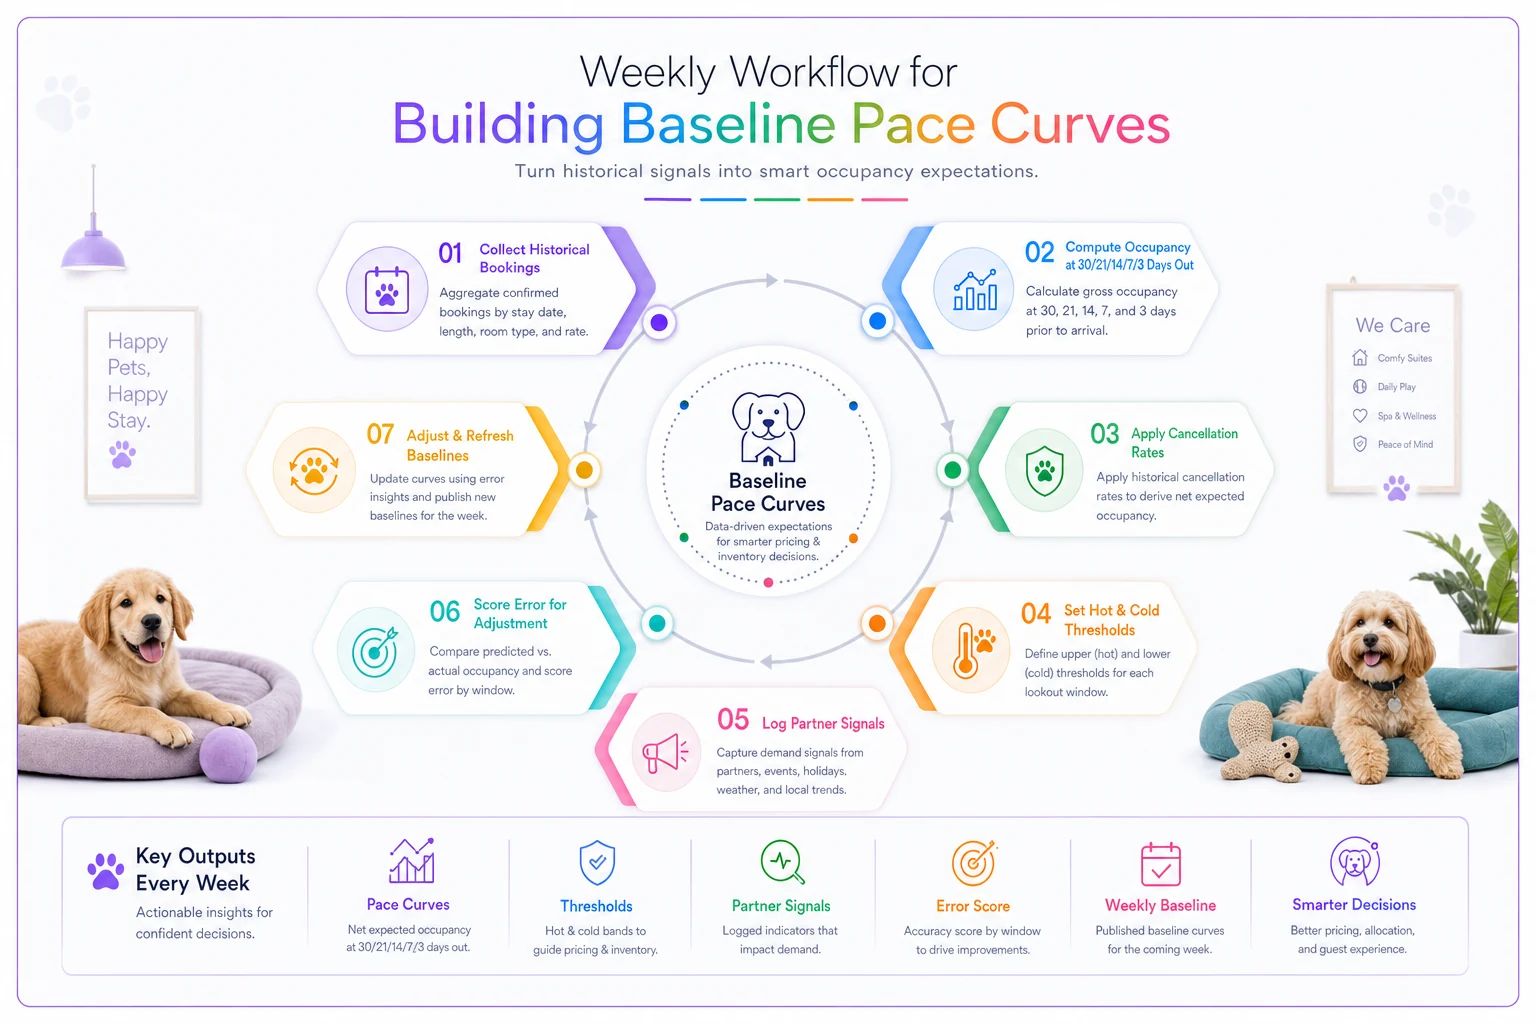
Bucket your dates. Sort the last 12–18 months of stays into date types: regular weekday, weekend, minor holiday (three-day weekends), major holiday (Thanksgiving, winter break, July 4th window). Peak and off-peak behave nothing alike; don't mix them.
-
Build the pace curve for each bucket. For each type, calculate average occupancy at 30, 21, 14, 7, and 3 days out. This is your baseline—the ruler you'll measure every future date against.
-
Compute your net rate. For each bucket, find the typical cancellation percentage and how late those cancellations land. Apply it so your forecast reads in expected occupancy, not booked.
-
Set threshold bands. Decide what counts as "hot" and "cold." A reasonable starting point: more than 10–12 points above the curve is hot, more than 10–12 below is cold. You'll tune these after a few weeks.
-
Log partner signals in one place. A running note of anything external that could move demand—vet referrals up, a competitor closed, a marathon in town. Ten minutes a week keeps it useful.
-
Score error and adjust. Each week, compare last week's forecast to what actually happened. Track two numbers only: average miss (how far off, on average) and bias (are you consistently over or under). If you're always over-forecasting weekends, your cancellation assumption is probably too low.
That last step is the one everyone skips. It's also what separates a forecast people trust from a spreadsheet people quietly ignore. You don't need fancy error metrics—mean absolute error in occupancy points and a plus/minus bias number are enough to catch drift.
The weekly ritual that makes it stick
Forecasting dies when it lives in someone's head or only comes out during a crisis. The fix is a short, fixed ritual—same day, same 45 minutes, same agenda.
-
Pull the pace read for the next 30 days by date type. Flag anything hot or cold.
-
Check net expected occupancy against staffing already scheduled. Adjust the roster for flagged dates.
-
Review procurement for the next order cycle against expected volume, not last month's.
-
Set or confirm pricing moves on flagged dates—rate bumps on hot weeks, promos on cold ones.
-
Log partner signals and note anything that should override the model.
-
Score last week's forecast—record the miss and the bias, adjust one assumption if there's an obvious pattern.
Lock the ritual on the same day each week so it becomes a habit and is less likely to be skipped.
The point of a ritual is that it removes the "should we look at this?" decision. You always look. Over a couple months, the flags start feeling obvious in advance, and the scramble the week of a holiday mostly disappears. The forecast becomes something you glance at and act on, not a report you generate and file.
This pairs naturally with metrics discipline. If you're already tracking the numbers in The 6 KPIs every pet hotel needs—and the experiments that fix them, the forecast gives those KPIs a forward-looking twin—so you're steering by where you're going, not only where you've been.
A real scenario: the holiday week that used to hurt
A single-location facility, around 40 kennels, kept getting burned on the same few peak weeks every year. Their pattern: staff and order based on how the calendar looked ten days out, which always felt slow, so they'd under-prepare. Then a late rush would fill the place, they'd scramble for coverage, pay overtime, and run short on food mid-week. Rates stayed flat the whole time because nobody wanted to "risk" raising them while occupancy looked soft.
After building a pace curve, they saw the actual story: that "soft" ten-day-out reading was completely normal for a major holiday. Their bookings always came in late for those weeks. The panic had been a misread, every single year.
The fixes were unglamorous. They raised rates on the last third of holiday inventory once pace crossed the hot threshold—which it reliably did around 12 days out. They pre-scheduled one flex tech for those flagged weeks instead of paying scramble overtime. They bumped the food order a cycle earlier. Over the next peak stretch, overtime on those weeks dropped by roughly a third, they stopped running short on supplies, and the rate adjustments added a few thousand dollars across the holiday periods. Not a windfall. Just money they'd been leaving on the table by mispricing under uncertainty. The bigger win was quieter: those weeks stopped feeling like emergencies.
When this makes sense—and when it doesn't
When it's worth building. If you have distinct peak periods, meaningful cancellation volume, and enough monthly bookings that a bad staffing or pricing call actually costs you—this pays for itself quickly. Facilities with sharp holiday swings get the most out of it, because those are exactly the dates where intuition fails.
When it's premature. A very small operation running near-constant full occupancy with tiny variance doesn't need pace curves. If you sell out every week regardless, your problem is capacity and pricing, not forecasting. Build the forecast when demand is variable enough to be worth predicting.
Who should not start here. If your booking data is a mess—inconsistent date entry, no clean history, cancellations not logged properly—fix the data hygiene first. A forecast built on bad inputs will confidently point you in the wrong direction, which is worse than no forecast at all. Get twelve months of clean records before you trust any curve.
Where software quietly earns its place
You can run the whole thing manually, and plenty of facilities should start that way to actually understand the mechanics. But the manual version breaks in predictable spots as you grow: pulling pace by date type across two or three locations, keeping cancellation assumptions current, catching a date drifting hot before someone happens to glance at it.
That's where operational software with light AI automation stops being a gimmick and becomes genuinely useful—not to make the decisions, but to keep the signals visible. The right platform watches pace against baseline, flags a date that's running hot before you'd catch it manually, applies your cancellation math automatically so you're always looking at net expected occupancy, and surfaces the recommended staffing or pricing action based on the thresholds you set. The monitoring happens in the background so the weekly ritual takes fifteen minutes instead of forty-five, and the flags don't depend on someone remembering to look.
The judgment stays with you. The software just makes sure a hot week never sneaks up quietly again.
The shift worth making
Pet hotel occupancy forecasting isn't about predicting the future perfectly. It's about reading pace early enough to act while you still have options—to raise a rate before the week sells out underpriced, to schedule coverage before it costs overtime, to order supplies before you run short mid-holiday.
The calendar tells you where you are. Pace tells you where you're going. Build the system that reads the second one, keep it honest with simple error scores, and run it on a fixed weekly rhythm. That's the whole game.
Pet hotel occupancy forecasting isn't about predicting the future perfectly. It's about reading pace early enough to act while you still have options—to raise a rate before the week sells out underpriced, to schedule coverage before it costs overtime, to order supplies before you run short mid-holiday.
The calendar tells you where you are. Pace tells you where you're going. Build the system that reads the second one, keep it honest with simple error scores, and run it on a fixed weekly rhythm. That's the whole game.
Ready to optimize your pet hotel operations?
Join hundreds of pet hotels using GoPetel to save time, improve pet care, and increase booking reliability.