



Most pet hotels don't have a demand problem. They have a shape problem. Weekends sell themselves. Holidays overflow. But Tuesday through Thursday in mid-November? That's where the P&L quietly bleeds, and it's exactly the demand you can't buy back once the night passes.
The trap is measuring marketing in total bookings, which flatters channels that bring in weekend and holiday traffic you were going to get anyway. A Facebook campaign "generating" 40 bookings looks great until you notice 34 of them landed on Fridays and Saturdays you'd have filled regardless. You paid to accelerate demand that already existed. Meanwhile the weekday capacity that actually drives your margin sits empty.
A solid pet hotel demand generation system isn't about spending more. It's about scoring each channel by the kind of nights it produces, mapping expected demand across a rolling calendar, and running small budget experiments against the weekdays you specifically need to fill. The whole thing lives or dies on one discipline: forecasting nights by weekday, not bookings by month.
The reason this breaks: channels get averaged, nights don't
Here's the structural flaw in how almost everyone evaluates marketing. You take spend, divide by bookings, and call it CAC. Clean number. Totally misleading.
A "booking" is not a unit of value in a boarding business. A night is. And nights are wildly unequal. A Saturday night at peak season might be worth 1.6x a Tuesday in the off-season once you factor in rate, utilization, and the opportunity cost of turning away nobody. When you average all of that into a single blended CAC, you lose the ability to see which channels are actually solving your worst inventory problem.
In real operations, this usually shows up as a slow drift toward channels that feel productive. Paid social and OTAs tend to over-index on high-demand dates because that's when pet parents are actively searching. So your dashboards reward the channels that fill the easy nights, and you keep feeding them budget. Six months later your weekend occupancy is 95% and your midweek is stuck at 50%, and nobody can explain why marketing "isn't working" despite rising spend.
The fix starts by refusing to average. Every channel gets scored on what kind of nights it delivers, and every dollar gets evaluated against the weekday it fills.
Building the channel-scoring matrix
The scoring matrix is the backbone. The goal is to rank channels not by volume but by their fit against your actual demand gaps — scored across a handful of dimensions, weighted toward outcomes that matter for your facility.
Never miss a booking or detail again.
GoPetel simplifies pet hotel operations by managing every reservation and pet profile seamlessly.
- Centralized booking management
- Automated client notifications
- Staff and kennel scheduling
No credit card required
Here's the structure that holds up across facilities of very different sizes:
| Channel | Weekday-fill ratio | CAC (per night) | Lead time | Rebook rate | Margin after fees | Score |
|---|---|---|---|---|---|---|
| Referral / word of mouth | High | Low | Long | High | Full | 9.1 |
| Local events / community | High | Low-Med | Med | Med-High | Full | 8.4 |
| Google (branded search) | Med | Low | Short | High | Full | 8.0 |
| Google (non-branded) | Med | Med | Short | Med | Full | 6.5 |
| Paid social | Low-Med | Med-High | Short | Low-Med | Full | 5.2 |
| Aggregators / OTAs | Low | High | Short | Low | Minus commission | 3.9 |
A few things worth noticing in that table, because these patterns repeat across facilities:
-
Weekday-fill ratio is the dimension nobody tracks, and it's the most important one. It's simply the share of a channel's bookings that land Monday–Thursday. Referrals and community channels tend to skew toward planned, mid-week stays — vet visits, work travel, scheduled trips. Paid social and aggregators skew toward last-minute weekend and holiday demand.
-
Lead time matters because short-lead channels can't help you plan. If a channel only produces bookings three days out, it can't fill a calendar gap you're staring at six weeks ahead. Long-lead channels are what let you steer occupancy before it's too late.
-
Margin after fees is where aggregators quietly lose. A 15–25% commission on an already-thin night can turn a "booking win" into a break-even — especially midweek at off-peak rates.
The scoring itself can be a simple weighted 1–10 across each column. Weight weekday-fill and margin highest, because those are the two things your other systems can't easily recover. Branded search often scores high despite modest volume — it's cheap, high-intent, and converts people who were already going to choose you. That's the kind of nuance a blended CAC number destroys.
The 12-week demand calendar
You can't prioritize channels in a vacuum. You prioritize them against a forecast. The demand calendar is a rolling 12-week view, broken down by weekday, showing projected occupancy against capacity.
Why 12 weeks: it's long enough to catch the lead-time of your planning channels (referrals and branded search often book 4–8 weeks out) but short enough that your forecast isn't fantasy. Anything past 12 weeks is a planning horizon, not a demand forecast.
Here's how the calendar comes together:
-
Pull two to three years of historical nights by weekday. Not bookings — nights occupied. Break it down by day of week and week of year.
-
Layer in lead-time curves. For each week out, what percentage of final occupancy is typically on the books by now? If you normally sit at 60% of final midweek bookings four weeks out and you're only at 40% this cycle, that week is a gap.
-
Mark your capacity ceilings. Weekends might be realistically capped by staffing, not kennels. Midweek is almost always uncapped demand-side.
-
Flag the gaps by weekday. The output you want is a grid
each of the next 12 weeks, each weekday, color-coded by how far projected occupancy sits below your target.
-
Assign a "fill priority" per cell. A Tuesday three weeks out forecasting 45% against a 75% target is high priority. A Saturday already at 90% is zero priority — stop spending there.
That last step is the whole point. Your marketing attention and budget flow toward the high-priority, under-forecast weekdays — not toward whatever's trending in the ad manager.
This connects directly to the off-peak demand work covered in turning local events into weekday bookings, because community channels are one of the few reliable ways to move midweek inventory with enough lead time to actually plan around.
The visual matters here. A spreadsheet works, but once you can see the whole 12 weeks laid out by weekday, the gaps become obvious in a way that a summary report never captures.
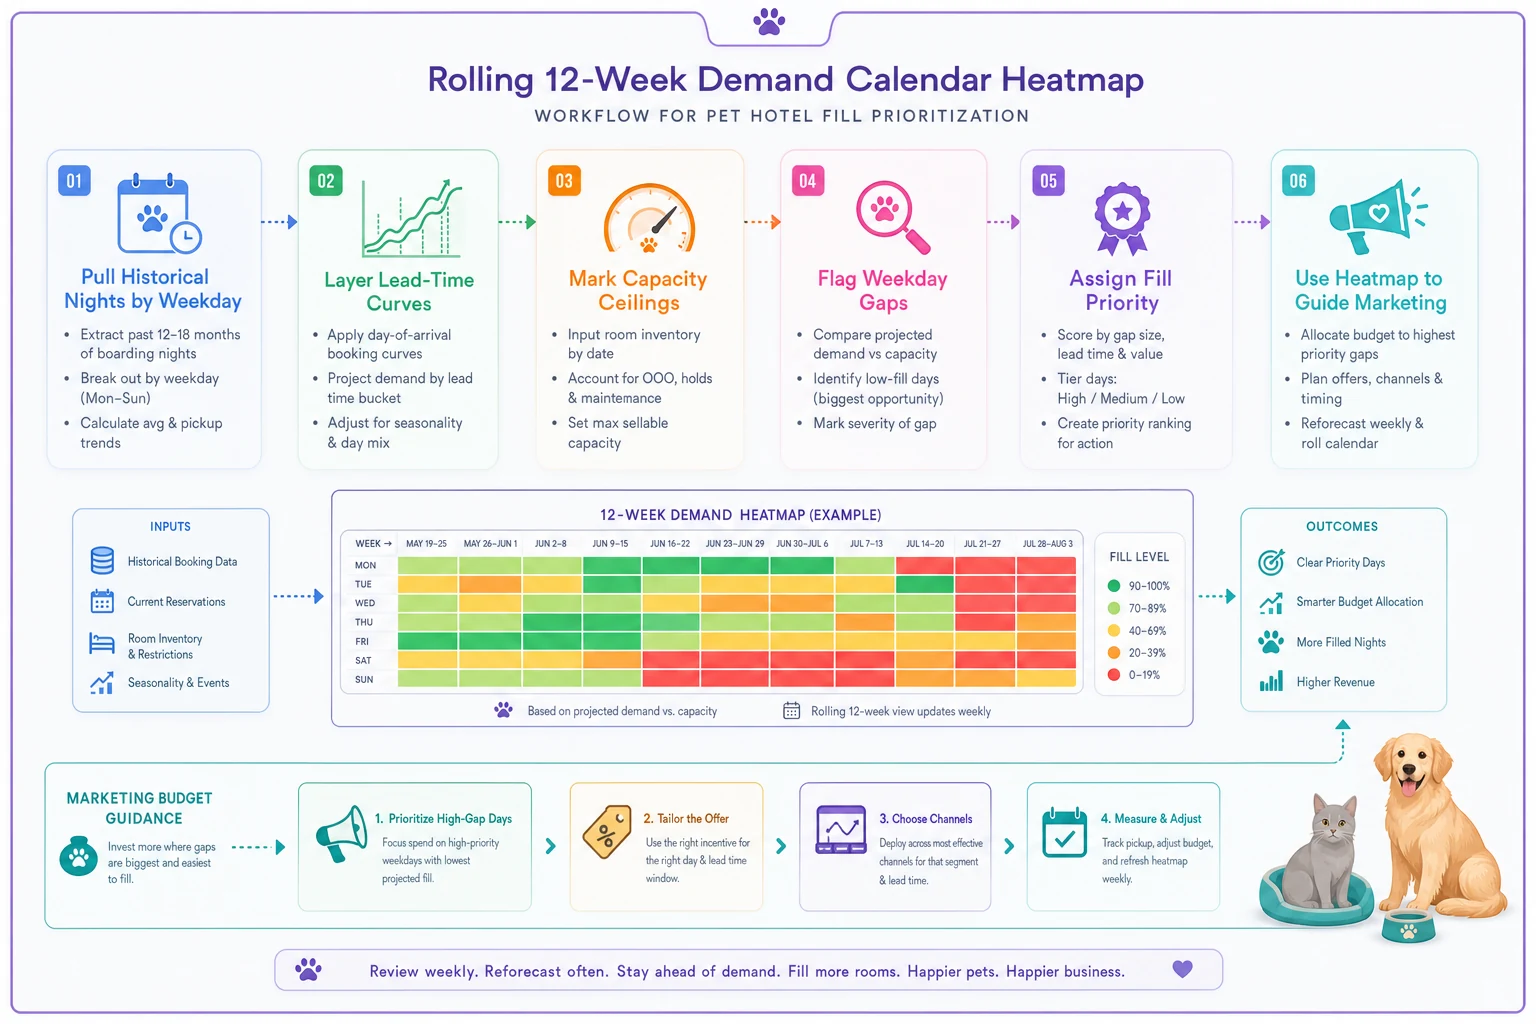
The visual matters here. A spreadsheet works, but once you can see the whole 12 weeks laid out by weekday, the gaps become obvious in a way that a summary report never captures.
Per-channel ROI tied to nights-by-weekday
Once the calendar tells you which nights need filling, the ROI template tells you which channel to use and whether it pencils out. The key shift: you're measuring CAC per night, segmented by weekday band.
A realistic template tracks, per channel:
-
Spend (direct + attributed staff time for things like community outreach)
-
Nights produced, split into weekend/peak vs weekday/off-peak
-
CAC per weekday night vs CAC per weekend night
-
Net margin per night after commissions and discounts
-
Rebook rate of acquired clients (because a channel that brings one-time bookers is worth far less — more on that below)
Here's what this looks like in practice. A mid-size facility around 40 runs was spending roughly $2,800/month across paid social and an aggregator. Blended CAC looked fine — call it $34 per booking. But when they split it by weekday band, paid social was producing weekday nights at a CAC of about $61, while the aggregator's weekday nights (after commission) were running closer to $80 once the reduced rate was factored in. Meanwhile branded search was pulling weekday nights at under $15, and a small community-event push was landing midweek bookings at roughly $20–25 all-in including staff time.
They shifted around 40% of the paid-social budget into branded search and event sponsorship. Over the following quarter, midweek occupancy moved from the low 50s into the mid-60s, and overall marketing spend actually dropped slightly. The weekends didn't suffer — they were never the problem.
The "expensive" channels weren't expensive on average. They were expensive exactly where it hurt — on the nights the business needed most.
Budget-to-nights experiments and gating rules
You don't reallocate budget on a hunch. You run small, bounded experiments and let gating rules decide what survives.
A budget-to-nights experiment is simple: take a defined budget, point it at a specific weekday gap in the calendar, and measure incremental nights — not total nights. Incremental matters because some of what you "generate" would have booked anyway. The crude way to estimate incremental: compare the filled rate of targeted weekday cells against comparable untargeted ones.
-
Minimum test budget, maximum test duration. A channel gets a 3-week test with capped spend before it's judged. No open-ended "let's keep trying."
-
A CAC-per-weekday-night ceiling. If a channel can't bring midweek nights under your defined threshold (say, 30% of average nightly rate), it gets cut or capped at weekend-only use.
-
A rebook floor. If acquired clients from a channel rebook below a set rate within 90 days, the channel is treated as volume-only and budgeted accordingly.
-
A margin gate for commissioned channels. Any aggregator night that nets below a floor margin gets rate-fenced to peak dates only, where the commission is easier to absorb.
The rebook floor is the one people skip, and it's quietly the most expensive omission. A channel that fills a Tuesday once but never again is fundamentally different from one that fills it and starts a real relationship. This is where channel scoring has to connect to your lifecycle work — the economics change completely when you factor repeat behavior, which is exactly why a real client-lifecycle and rebooking system belongs in the same conversation as acquisition. Acquisition CAC means very little without retention to spread it over.
The worksheets managers can actually run
The system only works if a manager can run it without a data analyst. Three worksheets do the job.
Worksheet 1 — Weekly gap review (15 minutes, Monday morning):
-
Pull the 12-week calendar, scan for cells below target
-
Rank the five highest-priority weekday gaps by fill priority × lead time
-
Confirm which channels are currently pointed at those gaps
Worksheet 2 — Channel scorecard update (monthly):
-
Refresh each channel's weekday-fill ratio, CAC per weekday night, and rebook rate
-
Recompute the weighted score
-
Flag any channel that's drifted below a gating threshold
Worksheet 3 — Experiment log (ongoing):
-
One row per active experiment
channel, target weekday gap, budget cap, end date
-
Record incremental nights and CAC per weekday night at close
-
Decision column
scale / hold / cut
Keeping these three artifacts current is most of the battle. What breaks it at scale is the data assembly — pulling nights-by-weekday from your booking system, matching spend to outcomes, attributing rebooks across months. Doing that by hand across multiple channels every week is where the discipline quietly dies around month three.
This is the practical reason an AI-powered operational platform earns its place here: not to run your marketing, but to keep the calendar, scorecard, and experiment log populated automatically from booking and spend data so the weekly review actually takes 15 minutes instead of two hours. When the numbers come together on their own, managers keep running the loop. When they don't, everyone falls back to blended CAC and the whole system unravels.
When this system makes sense — and when it doesn't
It makes sense when you have real weekday/weekend imbalance, you're spending across more than two channels, and you have at least a year of history to forecast against. The more uneven your occupancy shape, the more this pays off.
It's a bad fit when you're brand new with no demand data, or when you're already at high occupancy every night. If you're turning away midweek bookings, your problem is capacity, not demand generation — put the energy into throughput and staffing instead.
Who should skip this for now: single-channel operators running entirely on word of mouth who aren't spending ad budget at all. If there's nothing to reallocate, build the calendar for planning purposes, but skip the experiment machinery until you're actually putting money into multiple channels.
The thing to hold onto
The reason pet-hotel marketing feels unpredictable isn't that demand is random. It's that most measurement systems can't tell the difference between a night you had to work for and a night that was coming anyway.
Score channels by the nights they actually deliver, forecast those nights by weekday, and spend against the gaps — and bookings stop feeling like weather and start feeling like something you can steer. Start with the calendar. Everything else — the scoring matrix, the ROI templates, the gating rules — is just how you decide where to point the budget once you can finally see which nights are empty.
Score channels by the nights they actually deliver, forecast those nights by weekday, and spend against the gaps — and bookings stop feeling like weather and start feeling like something you can steer. Start with the calendar. Everything else — the scoring matrix, the ROI templates, the gating rules — is just how you decide where to point the budget once you can finally see which nights are empty.
Ready to optimize your pet hotel operations?
Join hundreds of pet hotels using GoPetel to save time, improve pet care, and increase booking reliability.