



Most pet hotel owners track revenue and expenses in broad strokes—total monthly income, total payroll, maybe occupancy percentage. That approach misses the operational levers that actually drive profitability. You end up making expansion decisions on gut feel, pricing services without knowing your real margins, and discovering cash crunches only when they've already hit.
The difference between pet hotels that scale and those that plateau around 40-50% occupancy usually comes down to financial operations depth. Not complicated Wall Street models—just practical frameworks that connect daily operational decisions to monthly P&L outcomes.
Why standard accounting misses the operational reality
Your accountant delivers clean financial statements every month. Revenue up top, expenses below, net income at the bottom. Useful for taxes, nearly useless for operations.
Pet hotel financials require a different lens because the cost structure is genuinely unusual. Labor costs swing wildly between a Tuesday in February and the week before Christmas. Fixed costs per kennel shift depending on how you configure runs. Revenue per dog-night varies based on package mix and add-on attachment rates.
Standard P&L treats all of this as monthly averages—and averages hide the patterns that matter. A kennel showing 65% average occupancy might be losing money every weekday and barely breaking even on weekends. You'd never know from the monthly report.
Real insight comes from tracking unit economics. Understanding what each kennel actually earns after its share of fixed costs, variable cleaning time, and capacity constraints during peaks. That granular view reveals which services generate profit versus which ones just look good on paper.
Building your occupancy-driven P&L model
Start with true capacity, not theoretical maximum. If you have 50 kennels but staffing means you can realistically handle 38 dogs during normal operations, your real capacity is 38.
Never miss a booking or detail again.
GoPetel simplifies pet hotel operations by managing every reservation and pet profile seamlessly.
- Centralized booking management
- Automated client notifications
- Staff and kennel scheduling
No credit card required
-
Physical occupancy (dogs in kennels)
-
Revenue occupancy (revenue per available kennel)
-
Operational occupancy (accounting for turnaround time)
Physical occupancy tells you space utilization. Revenue occupancy reveals pricing effectiveness—two dogs at $35/night in separate kennels generates different economics than one dog at $55/night in a suite. Operational occupancy factors in the 45-90 minutes between checkout and the next check-in.
Your P&L should flex based on occupancy bands. Under 30%, you're essentially running break-even to maintain market presence. The 30-50% band is where fixed costs get covered and margin starts appearing. Above 50%, incremental revenue drops almost directly to the bottom line, minus variable supplies and overtime labor.
Most operators discover their true break-even sits around 42-45% operational occupancy, not the 30% they assumed. That gap explains why so many facilities feel cash-tight despite what look like decent booking levels.
Per-kennel economics that reveal hidden losses
Standard boarding seems simple—dog comes in, stays three nights, leaves. But kennel-level economics tell a messier story. That premium suite generating $75/night might actually lose money once you account for its larger footprint, longer cleaning time, and lower utilization rate.
Start by calculating your true cost per kennel-day. Include:
Fixed costs per kennel:
-
Rent/mortgage allocated by square footage
-
Insurance and utilities proportioned to space
-
Base staffing requirements
-
Depreciation on kennel infrastructure
Variable costs per occupied day:
-
Cleaning supplies and bedding
-
Food (if provided)
-
Direct labor for feeding/walking
-
Waste management
Hidden costs most miss:
-
Credit card processing on that specific transaction
-
Booking system fees
-
Time spent on special requests
-
Medication administration labor
A standard 4x6 run might carry $18-22 in daily fixed costs plus $8-11 in variable costs when occupied. That $45/night rate suddenly looks less profitable, especially if the dog needs medication twice daily (adding around 6 minutes of tech time) or the owner wants photo updates (another 3-4 minutes).
The economics shift noticeably between kennel types. Smaller runs often generate better margins despite lower rates because they turn faster and require less cleaning time. Luxury suites have real marketing value but frequently operate at break-even unless add-on attachment is strong.
One facility that started tracking per-kennel P&L found their "economy" runs at $35/night generated $12 margins while premium suites at $65/night only netted $8 after true costs. They restructured pricing and improved suite margins by roughly 40% within two months.
Seasonality patterns and cashflow runway
Pet hotel cashflow follows predictable seasonal swings that catch unprepared operators every single year. Summer peaks can generate 2.5x February revenue. February's bills still come due regardless.
Map your seasonal pattern across rolling 13-month windows. Most facilities see something like this:
-
January-February
35-40% occupancy trough
-
March-April
gradual climb to 45-50%
-
May
Memorial Day spike to around 70%
-
June-August
sustained 65-75% occupancy
-
September-October
drop back to 45-50%
-
November-December
holiday surges hitting 85-90%
The dangerous months aren't the slow ones—it's the transition periods. March looks better than February, so owners start spending. But March revenue doesn't land in your account until April, creating cash crunches right before the profitable season kicks off.
Build a runway calculator that factors your seasonal curve. Take your lowest three-month rolling revenue period (usually January through March), multiply by 1.2 for safety. That's your minimum cash reserve target. For a facility averaging $42k monthly, the winter trough might drop to $28k monthly—suggesting roughly a $34k reserve requirement.
That's survival money though. Growth requires different math. If you want to add staff in April to prepare for summer, you need February's cash to cover March training costs. Real runway has to fund both operations and strategic pre-positioning.
Track runway weekly, not monthly. A facility might show 2.8 months runway on the 1st but drop to 1.9 months by the 15th after payroll and vendor payments clear. Weekly tracking prevents surprises that monthly reviews miss entirely.
CAPEX thresholds and expansion decision rules
Every pet hotel owner faces the expansion question eventually. More kennels? Better facilities? Second location? These CAPEX decisions usually rely more on optimism than operational math.
Set clear thresholds before emotion enters the room. The baseline rule: don't expand physical capacity until you've sustained 75% operational occupancy for six consecutive months, including at least one slow season. That threshold ensures your existing operation generates enough cash to fund expansion without compromising service quality.
For kennel additions, calculate the fully-loaded cost per new run:
| Item | Cost Range |
|---|---|
| Construction | $3,500-8,000 per kennel |
| Additional HVAC/ventilation | $800-1,200 |
| Drainage and flooring | $600-900 |
| Gates and dividers | $400-750 |
| Proportional common area space | $1,200-2,000 |
Total investment typically lands between $6,500-12,850 per kennel. At 55% utilization and a $45 average rate, each kennel generates roughly $750 monthly margin after variable costs. Payback stretches 8-17 months under ideal conditions, but realistic timelines run 14-24 months once you account for ramp-up time.
Prioritize operational improvements (like creating convertible suites) over raw kennel additions when ROI is unclear.
The smarter CAPEX often isn't more kennels—it's operational improvements that boost existing asset utilization. A $15,000 renovation creating four convertible suites (switching between one large dog or paired small dogs based on demand) might generate better returns than adding six new standard runs for $45,000.
Second location math works differently. The threshold jumps to 85% sustained occupancy plus demonstrated management depth. You need a fully-trained manager who's handled peak season independently, proven systems that run without your daily presence, and 8-10 months operating capital for the new site.
Track CAPEX performance carefully. That grooming station you added—did it actually increase revenue by the projected $3,500 monthly? Those luxury suites—what's their real utilization versus standard runs? Most operators find their CAPEX assumptions were optimistic by 30-40%.
Hiring ROI and staffing investment rules
Adding staff feels risky when margins are tight, but understaffing costs more than overstaffing in pet hotels. The question isn't whether to hire—it's when additional labor generates positive ROI.
Your staffing ROI calculation needs four inputs:
-
Revenue capacity gained from the new hire
-
Service quality improvements that reduce churn
-
Overtime costs eliminated
-
Owner hours freed for growth activities
A new kennel tech at $17/hour (roughly $2,890 monthly full-time) needs to enable about $5,800 in monthly revenue to break even after employment costs. That sounds steep until you decompose where the value actually comes from.
If that tech allows you to accept 6 additional dogs per day during peak periods—bookings you'd otherwise turn away—that's $270 in daily revenue during high season. Just 10 peak days monthly covers half their cost. Add eliminated overtime (often $500-800 monthly), reduced owner weekend hours, and lower burnout-driven turnover, and the math turns positive faster than most expect.
The key is hiring ahead of demand curves, not behind them. If March bookings suggest April occupancy will hit 65%, hire in early March. Training takes 2-3 weeks, full productivity takes another 4-6 weeks. Hiring in April means you're understaffed during the months that actually matter.
Create graduated hiring triggers:
-
At 50% sustained occupancy
Add part-time flex coverage
-
At 60%
Convert part-time to full-time
-
At 70%
Add a dedicated full-time role
-
At 80%
Build a management layer
These thresholds assume proper pricing and packaging systems. If you're hitting capacity while underpricing, fix pricing before adding staff.
Building your financial operations dashboard
The frameworks above mean nothing without consistent tracking. Most pet hotel management software provides basic reports, but the metrics that actually matter for financial operations usually require custom tracking on top of whatever system you're running.
Your weekly dashboard should cover:
Occupancy Metrics:
-
Current week operational occupancy
-
4-week rolling average
-
YoY comparison for the same week
-
Forward 30-day booking curve
Unit Economics:
-
Revenue per available kennel
-
Average length of stay
-
Add-on attachment rate
-
Per-stay margin (not just per night)
Cashflow Indicators:
-
Days cash on hand
-
Weekly cash burn rate
-
Accounts receivable aging
-
Forward revenue pipeline
Labor Efficiency:
-
Revenue per labor hour
-
Overtime percentage
-
Dogs per staff member
-
Turnover costs (monthly)
Dashboards are scorecards though. The real value comes from connecting metrics to operational adjustments. When occupancy drops below 45%, what specific actions trigger? When per-stay margins compress, which costs get scrutinized first? Build response protocols for each threshold. That's what turns reactive scrambling into something resembling proactive management.
Here's a simple workflow visualization of how data should flow into your dashboard and trigger actions.
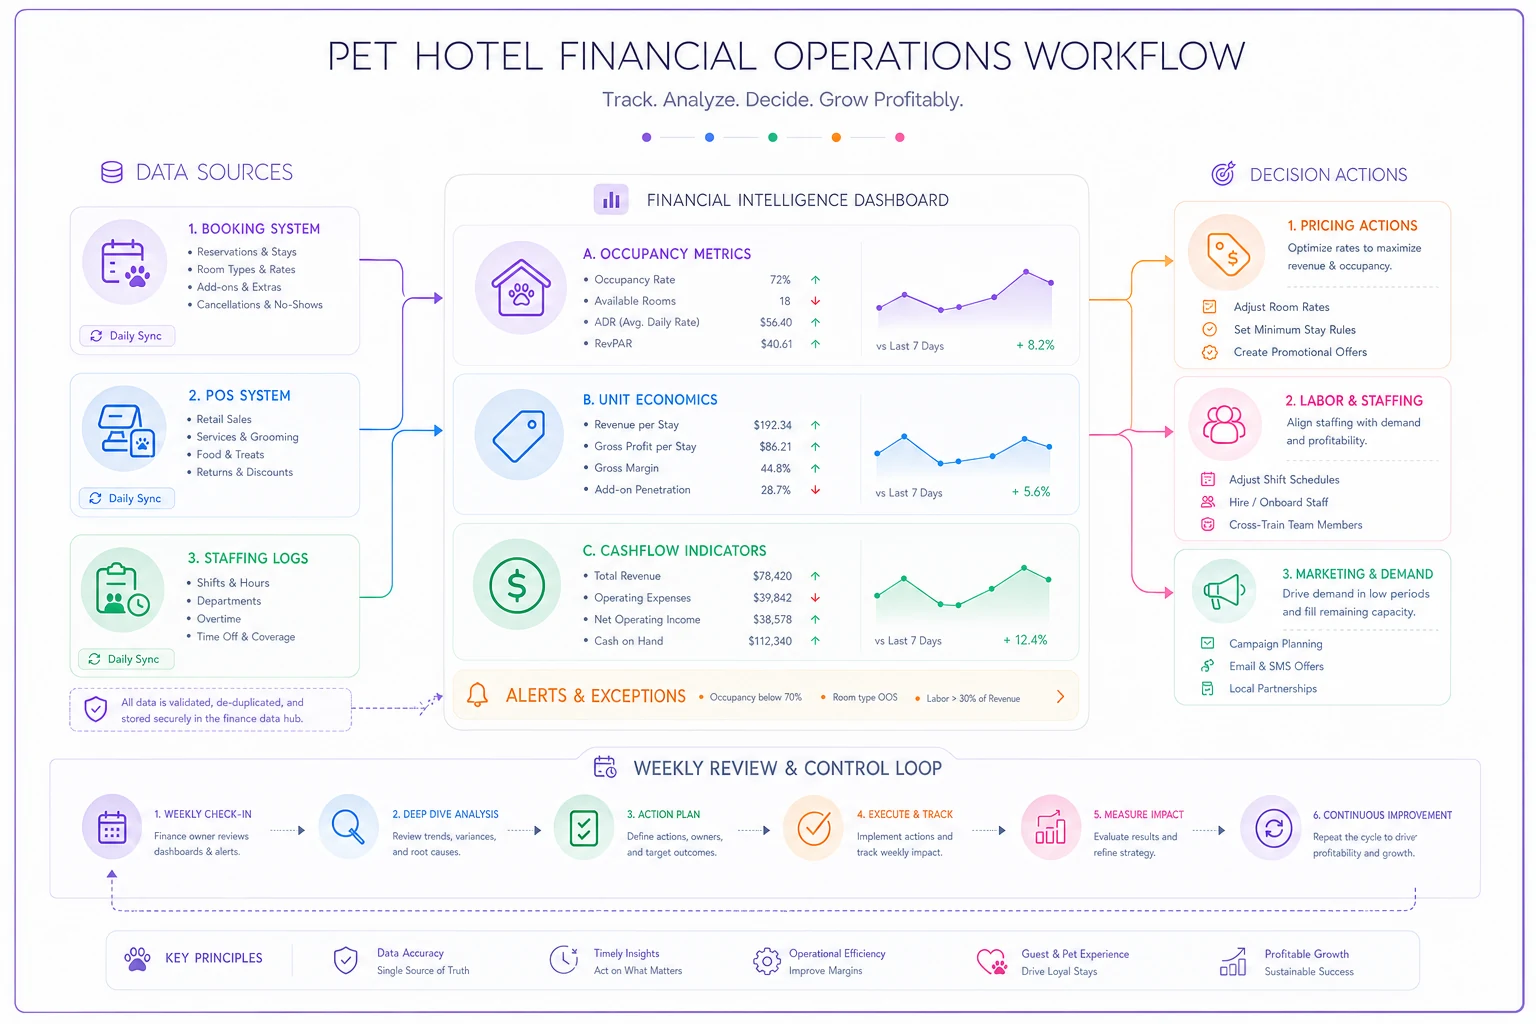
Use this workflow to align data sources and response protocols so actions follow the metrics automatically.
The technology enhancement opportunity
Modern pet hotel operations increasingly rely on AI-powered operational platforms to connect these moving pieces. Not because spreadsheets can't handle the math—they can—but because the real challenge is gathering accurate operational data quickly enough to actually act on it.
AI automation helps by pulling occupancy data directly from your booking system, calculating real-time unit economics as bookings come in, and flagging when metrics drift outside target ranges. Instead of discovering cashflow issues when bills come due, you see warning signs weeks earlier when course corrections are still possible.
The platforms that work best for pet hotels integrate financial tracking with operational workflows. When a groomer calls in sick, the system doesn't just adjust the schedule—it recalculates the day's revenue capacity and surfaces rebooking priorities. When occupancy projections show a slow week coming, it can trigger marketing activity and adjust pricing automatically.
This integration matters because pet hotel financial performance isn't driven by financial decisions alone. It's the compound effect of hundreds of daily operational choices—how quickly you turn kennels, which add-ons get offered, how you handle last-minute bookings. Each one creates financial impact that traditional accounting doesn't capture.
Common profit leaks hiding in plain sight
Even with solid frameworks, certain leaks persist across the industry.
The overnight staffing question is a good example. Many facilities maintain 24/7 staffing for premium positioning, but the math rarely holds up. Overnight staff runs $2,800-4,200 monthly. To break even, you'd need 80-120 additional nights monthly that you captured specifically because of overnight care. Most facilities generate 20-30.
Package pricing creates another quiet leak. "5 nights for the price of 4" sounds attractive, but if your occupancy already exceeds 60%, you're discounting revenue you would have captured anyway. Worse, packages lock in space during peaks when premium rates are possible.
Credit card processing on small transactions burns margin that owners ignore. A $15 daycare visit might cost $0.75 in processing—5% of revenue. Bundling weekly daycare into $65 packages drops that to around 1.8% while improving cashflow.
The medication administration trap catches well-meaning facilities off guard. Charging $3 per administration seems fair, but the true cost including trained tech time, documentation, and liability often reaches $7-9. Either price it appropriately or limit medical boarding to higher-margin specialized services that justify the complexity.
Late pickups during peak periods are just lost revenue. A 6pm Saturday pickup prevents Sunday morning check-in, costing a full night. Clear policies with automatic late fees prevent this one entirely.
Making the transition to data-driven operations
The gap between tracking these metrics and actually using them for decisions is where most pet hotels stall. Start with one metric that directly impacts this month's performance. For most facilities, that's forward occupancy tracking—knowing your booking curve 30 days out rather than discovering this week's openings on Monday morning.
Build the habit of weekly financial reviews. Not monthly—weekly. Monthly is too slow for a seasonal business. Spend 30 minutes every Tuesday going through:
-
Last week's actual versus expected performance
-
This week's booking curve
-
Next 30 days' pipeline
-
One operational adjustment based on what you see
After four consistent weeks, add per-kennel margin analysis. Which kennel types generate real profit? Should you convert standard runs to suites, or the reverse?
By week eight, work in cashflow runway projections. That prevents the March surprise when February's slow revenue hits your account right as you need to staff up for spring break.
The 6 KPIs framework covers additional operational metrics that connect to financial performance, but start with the money metrics first. Revenue covers a lot of operational problems—but only if you know where it's coming from and what it actually costs to produce.
Pet hotel financial operations don't require an MBA or complex modeling software. They need systematic tracking of the metrics that actually drive your business, clear thresholds for operational decisions, and the discipline to adjust when numbers drift off target.
The facilities successfully scaling past 60 kennels share similar traits. They know their per-kennel economics cold. They maintain cashflow reserves sized to their seasonal patterns. They hire ahead of demand curves. They make expansion decisions based on sustained performance metrics, not optimism about the market.
The playbook here—occupancy-driven P&L, per-kennel economics, seasonal cashflow planning, CAPEX thresholds, and hiring ROI rules—gives you the framework. Your job is implementing it consistently, adjusting for your local market, and resisting the urge to abandon discipline when times are good.
Start with your break-even occupancy calculation this week. That single number shapes every other financial decision you make. Once you know exactly where profitability begins, you can build toward sustained margins instead of hoping busy seasons cover the slow ones.
The math isn't complicated—but it is unforgiving. Better to know your numbers before they force themselves on you.
Ready to optimize your pet hotel operations?
Join hundreds of pet hotels using GoPetel to save time, improve pet care, and increase booking reliability.